Family Separation: Another Partisan Issue (Sigh)

A couple weeks ago, there were nation-wide protests fighting against family separation at the United States-Mexico border, a byproduct of President Trump’s recent zero-tolerance immigration policy. From DC to San Francisco to El Paso to small Midwestern towns, thousands of people turned out in support of family reunification.
In the weeks preceding the protests, the media was largely consumed by Trump’s immigration policies and its consequences for families. Political commentators met the decision with a variety of takes; Rachel Maddow of MSNBC broke down in tears after reading about “tender age” shelters, which house newly separated babies and toddlers. Co-host of Fox and Friends Brian Kilmeade, on the other hand, declared that, “Like it or not, these are not our kids… These are people from another country.”
Turning our attention away from partisan news outlets to the general public, national surveys show a general consensus that this policy is a bad thing for the country. A recent poll by Quinnipiac University asked if people oppose or support Trump’s immigration policy which leads to family separation; a reported 66% opposed while 27% supported. Another poll conducted by Rasmussen Reports asked a slightly different question; “When families are arrested and separated after attempting to enter the US illegally, who is more to blame — the parents for breaking the law or the federal government for enforcing the law?” The results to this question somewhat came into contrast with the previous poll, for 54% said that the parents are more at fault, while 35% blamed the federal government. The difference in wording is important to note, because the two questions really ask two different things; while many polls ask about the same topic, slight changes in wording can alter how people respond to the question, which then can skew the data.
With this in mind, we used our Trendency Research platform to gauge opinion on these policies. Trendency moves away from a binary view of issues and allows respondents to allocate percentages to their views. For this issue, there was a 0–100% option for approval and the same for disapproval of the policy. We believe that this allows people more flexibility in voicing their thoughts, as one’s opinions are rarely simple binaries as many traditional polls suggest.

The above graph shows a variety of different demographic’s average percentage of approval and disapproval of Trump’s policy. The lines are the averages, the average approval rate at 38% (in blue) and the average disapproval rate at 60% (in red). Though people certainly disagree with the policy more than they agree with it, the national averages perhaps do not reflect the broad disapproval that we sometimes assume exists when there are nation-wide protests.
Moving into the specific demographic trends, there are a few particularly notable differences. First, we see that this (not shockingly) is an extremely partisan policy; the Democratic approval rating (8%) is 65 points lower than the Republican approval rating (73%). This large gap shows how divisive this policy has been among voters, and also reflects a country that seems to be more divided by the day.
Something else that stands out from the data that we collected is how similar the opinions of Trump supporters and Republicans were. One assumption that people tend to make is that Republicans and Trump supporters are not necessarily one in the same, as many Republicans are not big fans of the President’s approach to many issues. However, we do not see this here. Republicans’ and Trump supporters’ answers only differ by 9%; a difference, but not a huge percentage. Additionally, they are the only two groups that approve of the policy more than they disapprove of it; no other groups come nearly as close. The next highest percentage of approval is from men (43%), making the difference of approval between men as a group and Republicans 30%. Granted, there is overlap between these two groups, but the gap between the top two support groups and everyone else is stark.
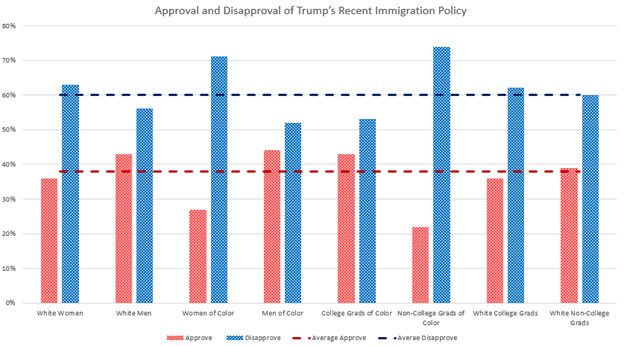
If we move away from partisan labels and look at race/ethnicity, we see a more nuanced difference in opinion. Somewhat unsurprisingly, we see that white men have higher rates of approval and lower rates of disapproval than white women. This split also occurs when looking at women and men of color, but to an even more extreme degree. Indeed, women of color have a 71% disapproval rate of the policy while just 52% of men of color feel the same way. The net difference between these two cohorts was incredibly surprising, with men of color having a net disapproval of 8 points while women of color have a net disapproval almost 6 times as high.
The intersection between race and education also yielded some interesting results. The difference between white college and non-college educated voters is very small; there are 3-point and 2-point differences between approval and disapproval percentages, respectively. But, among voters of color, there was more variance based on education. Interestingly, non-college educated people of color disagreed with the policy 22 points more than college educated members of this cohort.
This data’s relevance and implications grow as we look ahead at the November midterms. Because opinion is so split along party lines, it is unlikely that Congressional candidates would be able to use this as a persuasive campaign platform; it more likely will be a base motivation tool. Therefore, it’s unlikely that this issue will be hugely consequential for the upcoming House races; it may win a district or two, but because it is so highly contentious, and opinions are so entrenched, it may be a risky issue upon which to campaign for many candidates. If we were facing national elections, the story may be different, as the national averages show a more unpopular picture than popular. But until the election system is changed, expect this issue to be used mainly as a tool to excite the respective bases.
