Don’t Ignore the Chads

With the 2020 election less than a year away, the key question on every Democratic supporter’s mind is, “What voters can we move and persuade to ensure a Democrat is in the White House in 2021?”
Over the years, the Democratic Party has found solid support among people of color, college-educated women, and younger Americans; so far, it does not appear that 2020 will buck this trend. In previous elections, Democrats have spent a significant amount of time and effort targeting these groups as well as trying to grow support among groups that have shown openness towards their key issues. The impeachment inquiry has brought on a new variable in an already fluid situation, but whenever there is change or disruption there is always an opportunity to take advantage.
As of right now, our research suggests that Democrats may have a unique opportunity among some key demographic groups that are not on the traditional list of targets for the party. Trendency has been tracking impeachment support and opposition, along with the 2020 general election vote, since before the announcement of the impeachment inquiry in late September (overall results can be found here). Through our unique process, we are able to determine movement over time when it comes to opinions on these topics as well as study the interplay between them over time.
Considering that there is generally little overlap between a high vote likelihood for Trump and high levels of support for impeachment, we would expect that as support for impeachment falls, the vote likelihood for Donald Trump rises, and vice-versa. Though this is true of many of the demographics in our data, we see some key exceptions that could be the difference between a Democrat in the White House in 2021 or another four years of the Trump Administration.
Over the past two months, there has been a strong negative relationship between the likelihood of voting for Trump and support for impeachment, meaning that as support for impeachment rises, there is a relatively consistent decrease in the likelihood of voting for Trump. Given our partisan times, this is not exactly shocking.
For those of us who fell asleep in our most recent stats class, here is the overly-simplified 10 second version of this analysis: correlation is measured on a -1 to 1 scale. The closer you are to the two ends (-1 or 1) the stronger the correlation. Typically, anything above a 0.7 or below a -0.7 is considered to be a significant, or meaningful, correlation. Using our Trump and impeachment example, if everyone was 100% in support of impeachment and 100% likely to vote for Trump that would be a 1 on the scale (not to mention incredibly odd). If everyone was 100% supportive of impeachment and said there was a zero percent chance they would support the President’s re-election, that would be a -1 or a perfect inverse correlation. Correlation does not have to be at the extremes of the scale, but it helps us measure how connected one answer is to another.
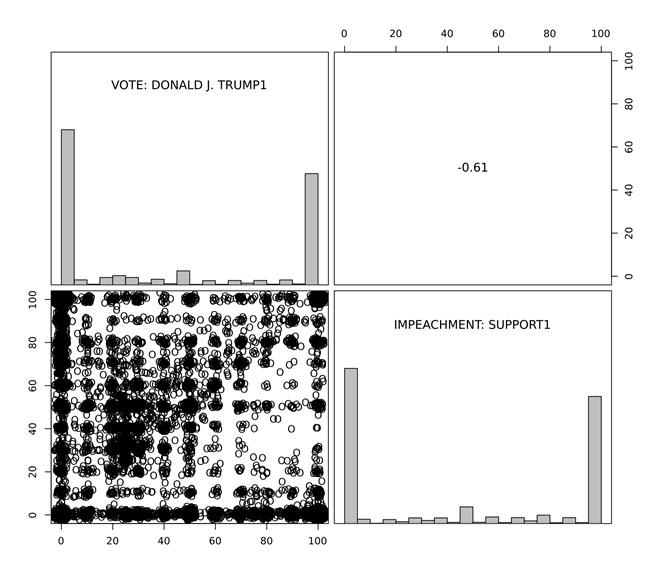
Overall, there is not a strong correlation between these two positions. As you can see in the chart below, the overall correlation stands at -0.58 (top right box). When you look at the distribution of responses, or histogram, we see in the bottom right that Americans are very divided in their views on impeachment, with the vast majority registering at the 0 or 100 ends of the spectrum. Of those who are in the middle, there is a more proportional spread in between (more at the middle, or 50 mark, and a somewhat-even step down as you move further to the extremes). In the top left, we see that for supporting Trump there is less of an even divide — more Americans at zero percent support than at the 100. The spread in between also skews towards the left side of the scale (or the non-support end). The bottom left square is the scatter plot of responses with each circle representing one respondent. Since this data is from a seven-week period, there are over 20,000 responses represented in there (so it’s a bit crowded).

Among voters of color, we see a lower correlation, which was surprising at first, until we looked into the data. Here, we saw that there was little variance in views on voting for Trump, but there was a division on views around the question of impeachment.

White voters are much more partisan in their views on both questions, and while the correlation is not in the significant range, it is closer to hitting that threshold.
Given the strong opposition to voting for Trump among voters of color, we decided to dig down into different demographics within white voters to see if we could unpack any interesting differences. If we look at white voters over the age of 50, we see a pattern that is relatively expected. Not only is there a high correlation between the two opinions (-0.75 in mid-October to -0.77 by the end of early November), but in the scatter plot on the bottom left (see chart below) we see that most voters in this cohort are concentrated on the edges of the chart with very few people were in the middle. The histograms (bar charts) show the distribution of opinions for each position and, as you can see, are very similar in shape both over time and compared to each other.

Given the strong polarization in the country and the fact that just about every American has an opinion on the President, these results did not strike us as unexpected. What was a bit of a surprise is what these results look like among the under-50 crowd.

A few things to note: first, the correlation dropped significantly (down at -0.4 during both time periods) compared to those over 50. Second, the distribution of opinions is much different than for those over 50. As you can see in the bottom left quadrant, there are concentrations on the edges, but there is also a large number of people living in the middle, and that has held consistent over the last couple months. Finally, the histograms are no longer closely matched. Indeed, when it comes to impeachment support the number of people is near-evenly proportioned between the two extreme positions. On the vote itself, however, we are seeing a more familiar pattern.
This pattern tends to hold true among these groups when we also factor in education levels. For both non-college white women and college-educated white women, the correlation between the two questions moves from a strong relationship (~ -0.75) among those over 50 to a weaker one when we look at those under 50.

We see an even greater difference, however, between young non-college and college-educated white men. While both non-college and college-educated white men over 50 exhibit patterns similar to those discussed above, the difference among younger voters is surprising.

For non-college white men, the relationship between impeachment support and the Trump vote drops from a strong relationship (~ -0.75) among those over 50 to a moderate strength (~ -0.50) among those under 50.

While college-educated white men over 50 follow a pattern similar to their non-college counterparts, the younger men do not.

For college-educated white men, the relationship falls from relatively strong correlation for those over 50 to extremely weak (~ -0.15) for those under 50. And it is worth noting that the relationship has been getting weaker over time.
So what does this mean for 2020? With a year to go, declarative statements are a recipe for some egg-on-face, but it does seem to suggest that Democrats might want to reconsider some of their target groups. Furthermore, there is a decent-sized cohort in the electorate that is taking a much more nuanced view of the impeachment proceedings.
